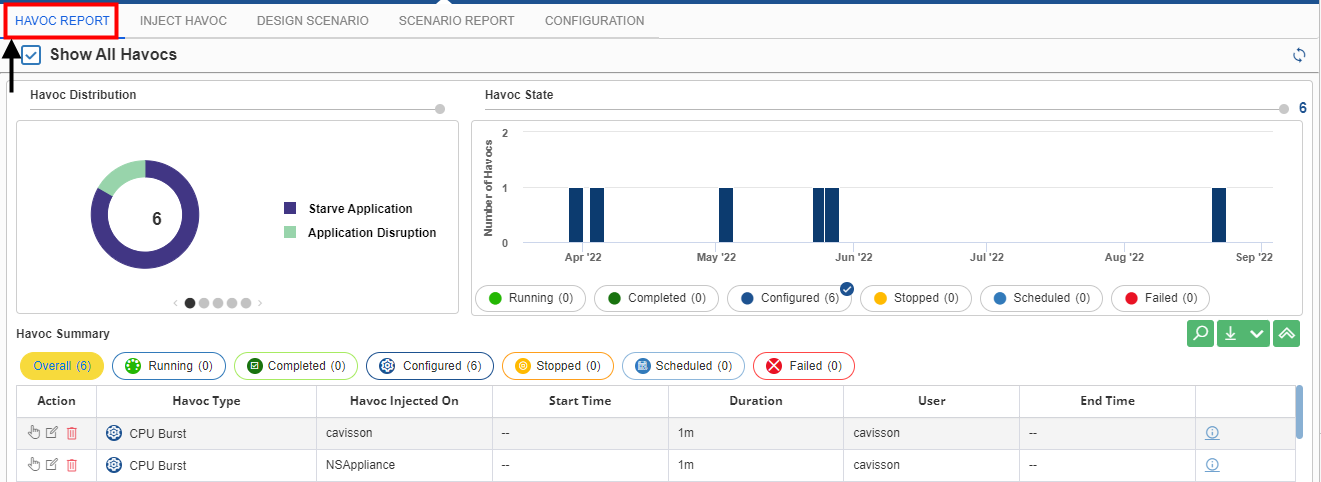
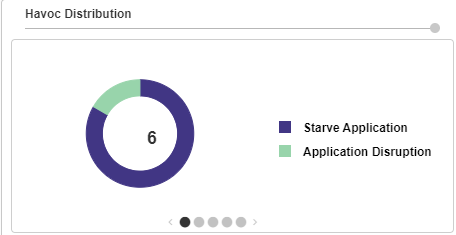
On the NetHavoc window, click the Havoc Report menu item on the top bar. This section displays the summary of the havoc. A user gets information about the havoc distribution, havoc states, and the summary of all havocs.


Havoc Summary
This section contains several tabs, namely Overall, Running, Completed, Configured, Stopped, Scheduled, and Failed that display the status of the havoc.
In each tab, a user gets detailed information about the injected havoc, such as action, havoc type, tier, server, start time, duration, havoc Id, user, end time, test run, and others.

· While creating a havoc, when a user selects Dynamic as the Server Selection Mode and applies it, the havoc is displayed as a parent node instead of a general node in the Havoc Summary. Click the icon to view the child nodes. · For Dynamic server selection mode, the ‘End time’ is displayed in parent node along with child nodes, after the havoc is completed. · The user can apply, delete, or update a havoc from the Havoc Summary itself if the havoc is at Ready To Apply status. · The user can also stop a havoc from the Havoc Summary itself but only when the havoc is at Running status. · The ‘Mode’ column in the ‘Reports’ section under the ‘Overall’ tab displays the mode in which a fault was configured. There are two modes – UI and API. |
Download Reports
You can download reports by clicking ![]() . You get the option to download the report in PDF, Word, or Excel formats.
. You get the option to download the report in PDF, Word, or Excel formats.
